Mapbox choropleth map
This example shows how to setup a choropleth map using mapbo. The data used is the GINI Index of all US Counties from ACS 5-year (2017). Mapbox vector tiles are used as it provides better performance than rendering large amount of GeoJSON polygons. This code is adapted from Mapbox’s example on Join local JSON data with vector tile geometries.
If you would like to use GeoJSON with mapbox check out the Additional Notes below. It is much simpler than using vector tiles but it is discouraged to load all counties via GeoJSON due to the large size.
See the completed example here.
Setting up
Import libraries and styles in the head. You can download citysdk.js here or build it using browserify.
<script src="https://api.tiles.mapbox.com/mapbox-gl-js/v1.2.0/mapbox-gl.js"></script>
<link
  href="https://api.tiles.mapbox.com/mapbox-gl-js/v1.2.0/mapbox-gl.css"
  rel="stylesheet"
/>
<script src="./citysdk.js"></script>
In the body setup a container with an id of map and add styles.
<style>
  body {
    margin: 0;
    padding: 0;
  }
  #map {
    position: absolute;
    top: 0;
    bottom: 0;
    width: 100%;
  }
</style>
<div id="map"></div>
In a script tag after the map div, we initialize the map with mapbox accessToken you can get from here
mapboxgl.accessToken = "<your access token here>";
var map = new mapboxgl.Map({
  container: "map",
  style: "mapbox://styles/mapbox/streets-v11",
  center: { lat: 37.0902, lng: -95.7129 },
  zoom: 3
});
Adding the Vector tiles
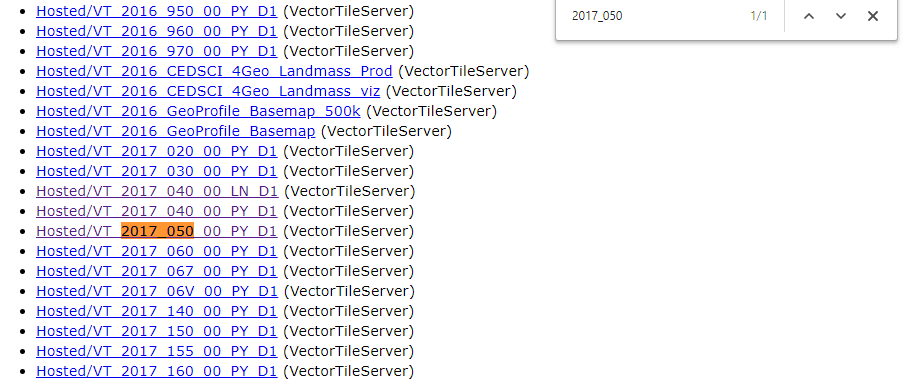
Census Bureau provides vector tiles via ArcGIS REST Services for various years and geographic levels.
To locate the vector layer we want first find the year then the geography level id. So for 2017 and county level we can look for
2017 and 050 using find in your browser.
Here are a few geographic level ids for common levels:
010 = United States
020 = Region
030 = Division
040 = State
050 = ….. County
060 = ….. ….. County Subdivision
140 = ….. ….. Census Tract
860 = ….. 5-Digit ZIP Code Tabulation Area
Find more here
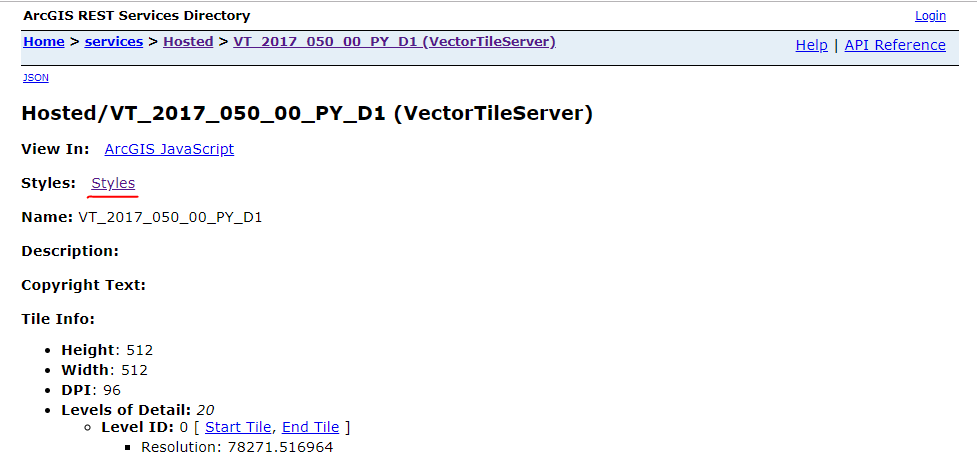
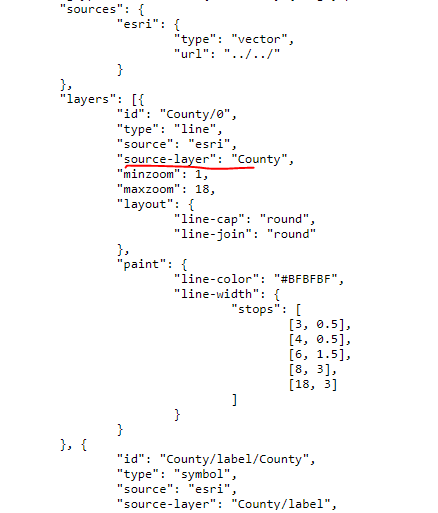
The layer is Hosted/VT_2017_050_00_PY_D1. Lastly we have to get the source-layer name. Click into the Styles and find the source-layer value. (in this case it is “County”)
Now lets load the vector tiles layer.
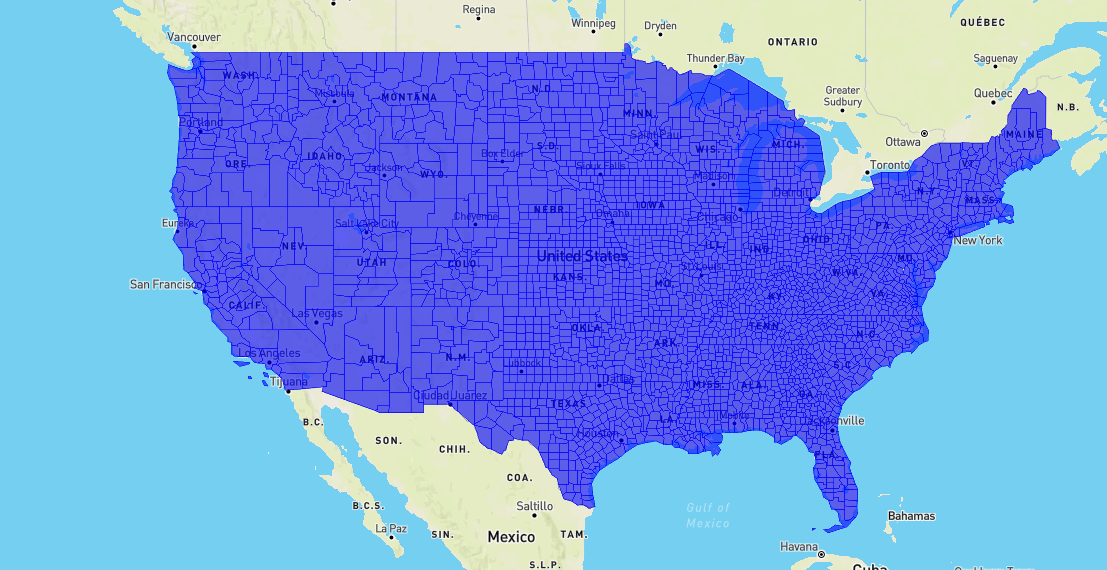
map.on("load", function() {
  map.addLayer({
    id: "counties",
    type: "fill",
    source: {
      type: "vector",
      tiles: [
        "https://gis-server.data.census.gov/arcgis/rest/services/Hosted/VT_2017_050_00_PY_D1/VectorTileServer/tile/{z}/{y}/{x}.pbf"
      ]
    },
    "source-layer": "County",
    paint: {
      "fill-opacity": 0.6,
      "fill-color": "blue"
    }
  });
});
Query data
We use CitySDK to query for the GINI Index from the ACS 5-year.
census(
  {
    vintage: 2017,
    geoHierarchy: {
      county: "*"
    },
    sourcePath: ["acs", "acs5"],
    values: ["B19083_001E"]
  },
  function(error, response) {
    console.log(response);
  }
);
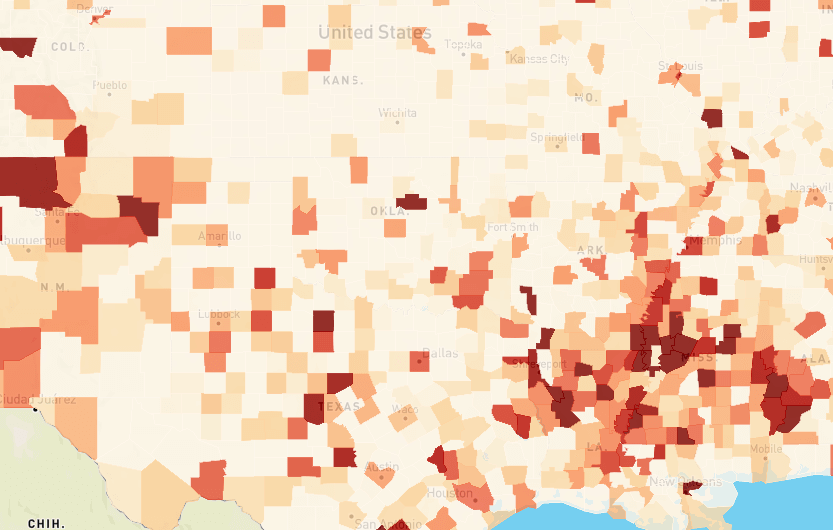
Merging data with vector tiles
Vector tiles do not originally contain the GINI data, so we need to “merge” the CitySDK data to the vector tiles. But the since the vector tiles and CitySDK data are from two different sources and types, the method used appends the CitySDK data with the fill color value to a mapbox style expression.
We refactor the map.on function to first load the CitySDK data, then generate the style expression, lastly load the vector tiles layer with styles.
To generate a color expression, we first create a function to generate the colors using Chroma.js. Add load Chroma.js via script tag in the head, then in the CitySDK callback get all the GINI Index values into an array to pass into chroma.js to domain (range of values)
<script src="https://cdnjs.cloudflare.com/ajax/libs/chroma-js/2.0.4/chroma.min.js"></script>
chroma.scale('OrRd').padding(.15) will specific the color scale (Orange to Red) , .domain(values, 'q', 5) will use the GINI values to generate a quantiles groups for the values.
Now we can create a function that will take in any value and return a hex color code.
var values = response.map(function(county) {
  return county.B19083_001E;
}); //get all the GINI Index values , B19083_001E

var colorScale = chroma
  .scale("OrRd")
  .padding(0.15)
  .domain(values, "q", 5);

function getColor(val) {
  return colorScale(val).hex();
}
To generate the style expression for mapbox styling, we have to group the GEOIds that fall into the same quantile groups. So we first loop though each to create an object with color groups as keys and array of GEOIDs as values.
e.g. {“#FFF” : [“04343”, “04343”]}
Then we generate the expression by appending the GEOIDs and colors to the main match expression in the format below.
e.g. [‘match’, [‘get’, ‘GEOID’], [“04343”, “04343”], “#FFF”]
Lastly we append ‘rgba(0,0,0,0)’ for any GEOIDs that is not included in the expression rules.
var colors = {};

response.forEach(function(county) {
  var GEOID = county.state + county.county;
  var value = county.B19083_001E;
  var color = getColor(value);
  if (!colors[color]) {
    colors[color] = [];
  }
  colors[color].push(GEOID);
});

var colorExpression = ["match", ["get", "GEOID"]];
var colorQuantiles = Object.entries(colors).forEach(function([color, GEOIDs]) {
  colorExpression.push(GEOIDs, color);
});

colorExpression.push("rgba(0,0,0,0)");
From that we can add the layer the same way but instead of a static fill-color we can put into our style expression.
map.addLayer({
  id: "counties",
  type: "fill",
  source: {
    type: "vector",
    tiles: [
      "https://gis-server.data.census.gov/arcgis/rest/services/Hosted/VT_2017_050_00_PY_D1/VectorTileServer/tile/{z}/{y}/{x}.pbf"
    ]
  },
  "source-layer": "County",
  paint: {
    "fill-opacity": 0.8,
    "fill-color": colorExpression
  }
});
Completed map and code should look like this.
map.on("load", function() {
  census(
    {
      vintage: 2017,
      geoHierarchy: {
        county: "*"
      },
      sourcePath: ["acs", "acs5"],
      values: ["NAME", "B19083_001E"]
    },
    function(error, response) {
      var values = response.map(function(county) {
        return county.B19083_001E;
      }); //get all the GINI Index values , B19083_001E
      var colorScale = chroma
        .scale("OrRd")
        .padding(0.15)
        .domain(values, "q", 5); // 5 quantiles

      function getColor(val) {
        return colorScale(val).hex();
      }

      //generate style expression
      var colors = {};

      response.forEach(function(county) {
        var GEOID = county.state + county.county;
        var value = county.B19083_001E;
        var color = getColor(value);
        if (!colors[color]) {
          colors[color] = [];
        }
        colors[color].push(GEOID);
      });

      var colorExpression = ["match", ["get", "GEOID"]];
      var colorQuantiles = Object.entries(colors).forEach(function([
        color,
        GEOIDs
      ]) {
        colorExpression.push(GEOIDs, color);
      });

      colorExpression.push("rgba(0,0,0,0)");

      map.addLayer({
        id: "counties",
        type: "fill",
        source: {
          type: "vector",
          tiles: [
            "https://gis-server.data.census.gov/arcgis/rest/services/Hosted/VT_2017_050_00_PY_D1/VectorTileServer/tile/{z}/{y}/{x}.pbf"
          ]
        },
        "source-layer": "County",
        paint: {
          "fill-opacity": 0.8,
          "fill-color": colorExpression
        }
      });
    }
  );
});
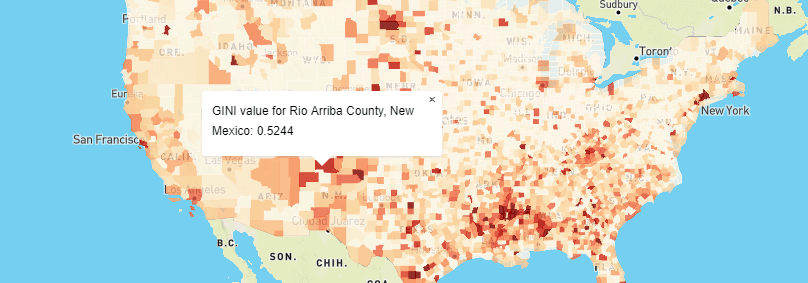
Adding a popup
Add an click listener to the counties layer, then in the callback search up the GEOID of the county of the feature that was clicked and setHTML to the response values.
map.on("click", "counties", function(e) {
  var coordinates = e.lngLat;
  //look up GINI value
  var GEOID = e.features[0].properties.GEOID;
  var details = response.find(function(county) {
    var response_GEOID = county.state + county.county;
    return GEOID === response_GEOID;
  });

  new mapboxgl.Popup()
    .setLngLat(coordinates)
    .setHTML("GINI value for " + details.NAME + ": " + details.B19083_001E)
    .addTo(map);
});
Additional Notes
Using GeoJSON
For smaller queries using the GeoJSON provide the same results without the need of additional complex code to generate the color expression or look up the data. But note that load times might be longer as GeoJSON takes a while to pull from the Github/CDN.
map.on("load", function() {
  census(
    {
      vintage: 2017,
      geoHierarchy: {
        county: "*"
      },
      geoResolution: "5m",
      sourcePath: ["acs", "acs5"],
      values: ["NAME", "B19083_001E"]
    },
    function(error, response) {
      map.addLayer({
        id: "counties",
        type: "fill",
        source: {
          type: "geojson",
          data: response
        },
        paint: {
          "fill-opacity": 0.8,
          "fill-color": [
            "interpolate",
            ["linear"],
            ["get", "B19083_001E"],
            0.2,
            "#ffffb2",
            0.4,
            "#fecc5c",
            0.6,
            "#fd8d3c",
            0.8,
            "#f03b20",
            1,
            "#bd0026"
          ]
        }
      });

      map.on("click", "counties", function(e) {
        var coordinates = e.lngLat;
        //look up GINI value
        var properties = e.features[0].properties;

        new mapboxgl.Popup()
          .setLngLat(coordinates)
          .setHTML(
            "GINI value for " + properties.NAME + ": " + properties.B19083_001E
          )
          .addTo(map);
      });
    }
  );
});